Multi Family Real Estate Review for the Portland Metro Market January 2019
Investor Highlights Rental Market 4+ units
The rental market has heated up. In general tempers are flaring over looming Senate Bill 608 which passed the House and is onto the Senate where it is expected to pass. Comparing the current year most recent 12 month run to the prior period reflects a market weighted toward sellers. Here’s how the numbers have worked out.
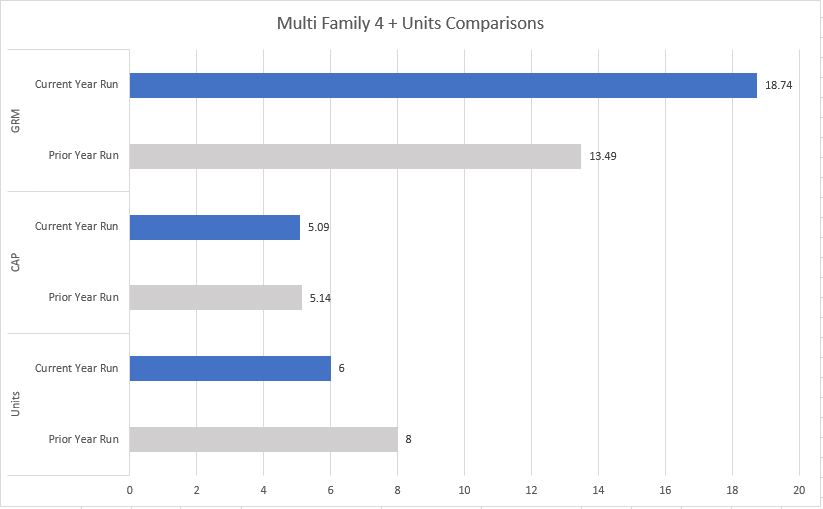
Note: Only sales of 4 plus units containing both Advertised CAP and Gross Rent Multiplier were used.
The average number of units per property sold declined. Prior period 8, Current Year 6. CAP rates dipped slightly from 5.14% in the Prior Year to 5.09% during the Current Year. GRM showed a dramatic change increasing from 13.49 the Prior Year to 18.74 during the Current Year.
Average List/Sold price remained balanced averaging 95% of list price in the Current Year and 94% during the Prior period.
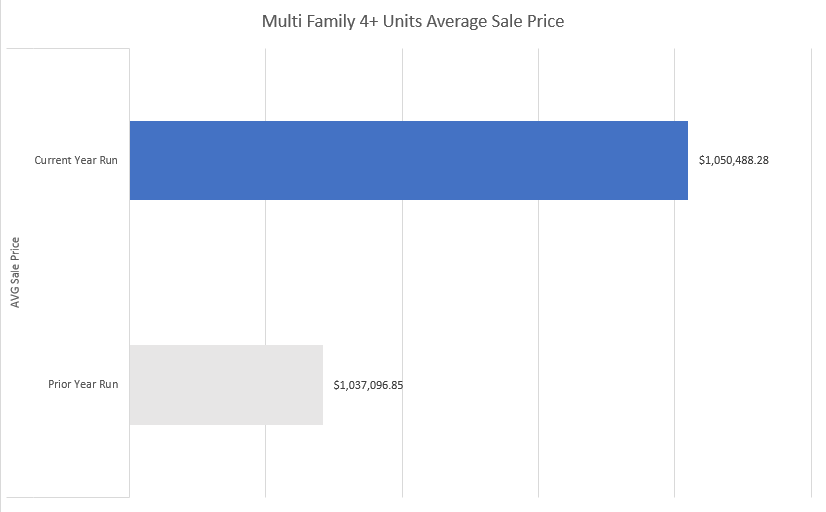
Most dramatic change in the Portland area between the two reporting periods is the average price per unit sold. This increased 26% from $129,637 during the prior period to $174,081 in the Current Year. The average advertised NOI per unit increased 24% from $7,643 during the prior period to $8,784 in the Current Year. This illuminates the price per unit increase.
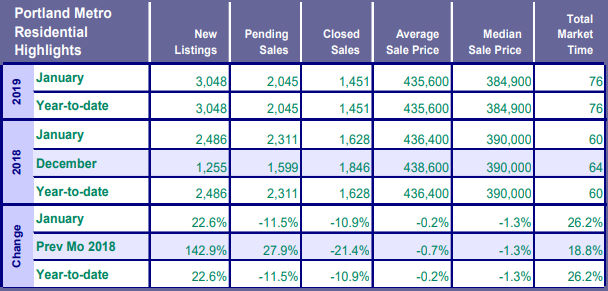
January Residential Highlights
The Portland area saw an uptick of new listings to begin the year this January. There were 3,048 new listings, a 22.6% increase over January 2018 (2,486) and more than double the 1,255 new listings offered last month in December 2018. The prior January that had more listings was in 2011, when 3,128 were offered.
Pending sales, at 2,045, decreased 11.5% from January 2018 (2,311) but surged 27.9% ahead of the 1,599 offers that were accepted last month in December 2018.
Closed sales, at 1,451, ended 10.9% cooler than last year in January 2018 (1,628) and 21.4% cooler than last month in December 2018 (1,846).
Inventory rose to 3.3 months in January, with total market time rising to 76 days.
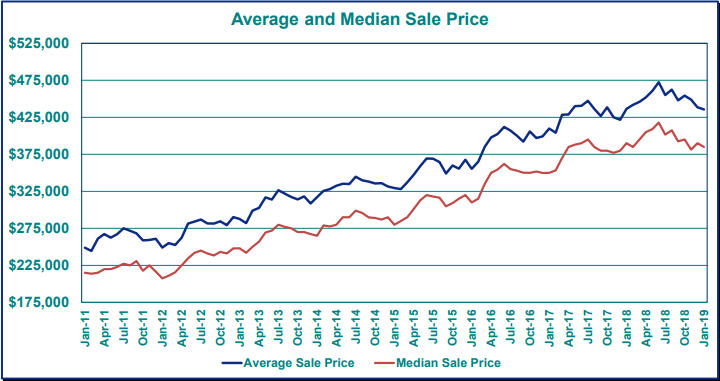
Average and Median Sale Prices
Comparing the average price of homes sold in the twelve months ending January 31st of this year ($452,200) with the average price of homes in the twelve months ending January 2018 ($430,000) shows an increase of 5.2%. In the same comparison, the median has increased 5.3% from $380,000 to $400,000.